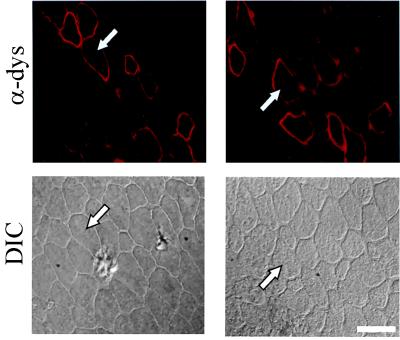
Figure 3.
Dystrophin expression in mdx muscles injected with MDX1 chimeraplast. Dystrophin-positive fibers from two MDX1-injected muscles are shown 2 wk after injection. For each muscle, the image on top shows dystrophin immunofluorescence staining (“α-dys”) and the image on bottom is the same region viewed with differential interference contrast (“DIC”) optics to show the surrounding fibers. The arrows in each pair point to the same fiber. (Scale bar represents 37.5 μm.)

