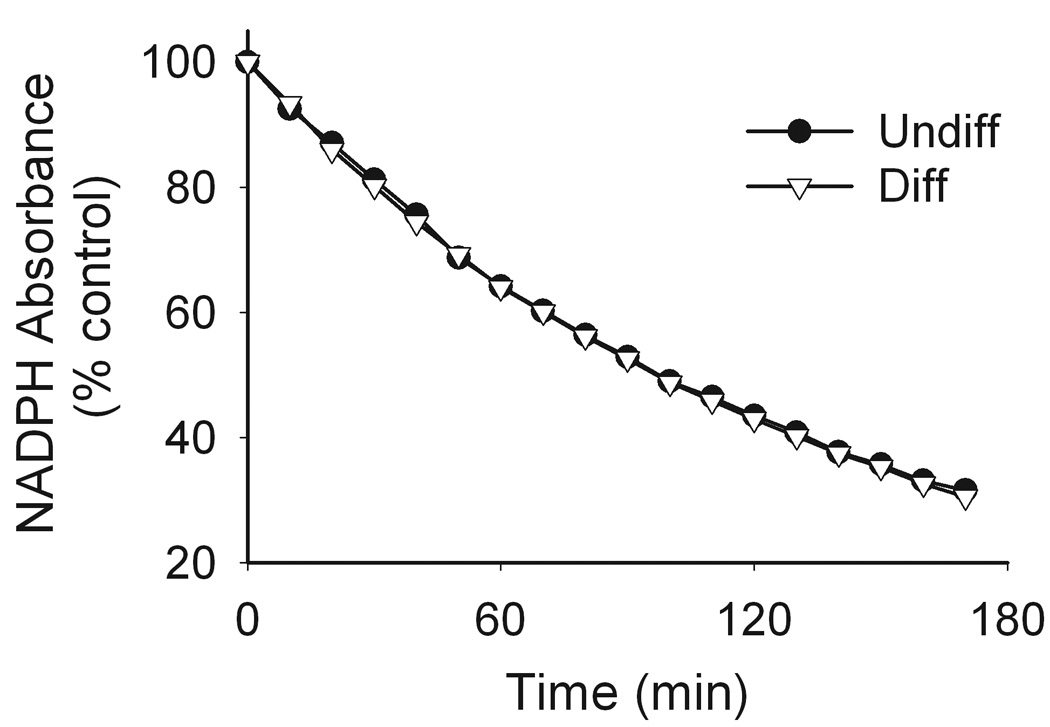
Figure 4. Effects of paraquat on NADPH metabolism.

Reaction mixtures contained cell lysates (130 µg/µl protein), 100 µM paraquat and 100 µM NADPH in a 1 ml cuvette. NADPH metabolism was assayed by monitoring changes in absorbance at 340 nm and were recorded every 2.5 min for 3 h using a UV/VIS spectrophotometer. Data are presented as percent of control. Circles, undifferentiated (undiff) cells; triangles, differentiated (diff) cells.
