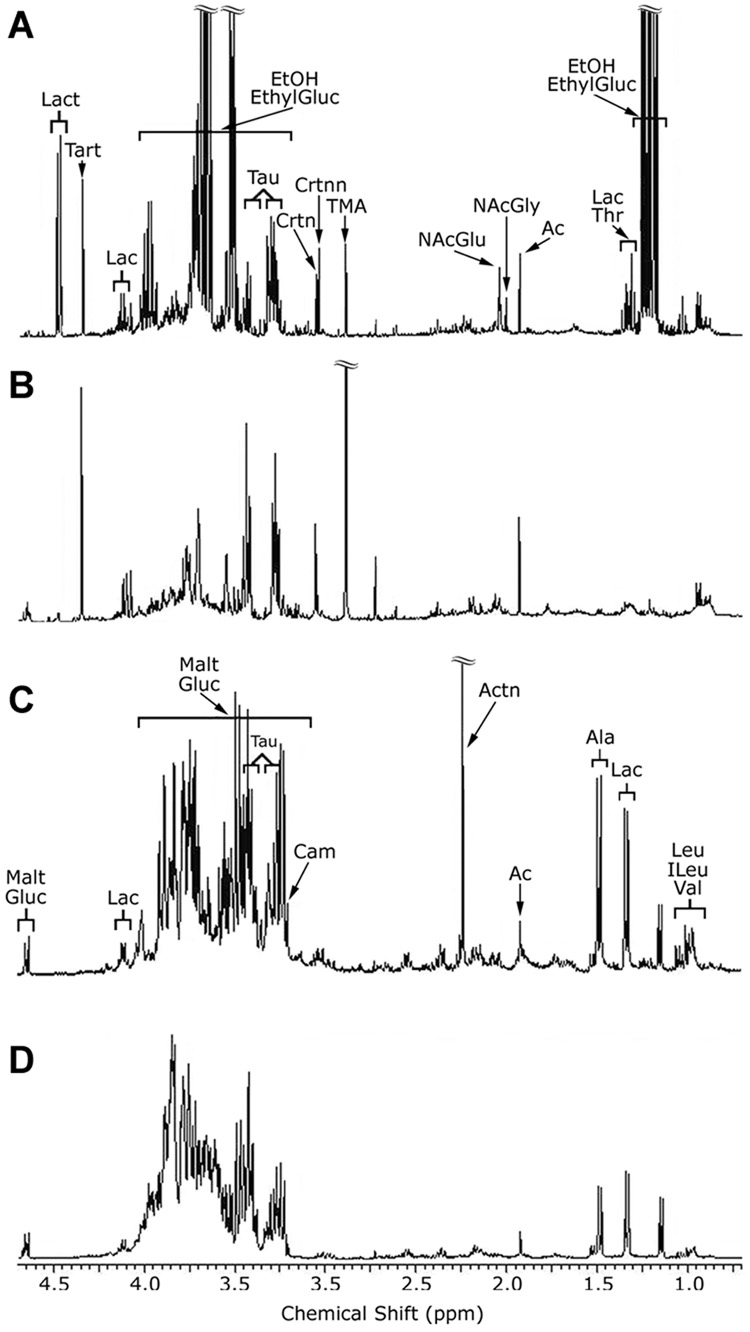
Figure 2.
1H NMR metabolomic analysis of urine and liver reveals biochemical pathways affected by alcohol in the mouse. Representative spectra expansions of mouse urine (A and B) and liver (C and D) from control (A and C), or alcohol-treated (B and D) mice. Spectra from the alcohol-treated mice are annotated with assignments of some of the metabolites present. EthylGluc, ethylglucuronide; EtOH, alcohol; Lac, lactate; Ac, acetate; NAcGly, N-acetylglycine; NAcGlu, N-acetylglutamine; TMA, trimethylamine; Crtnn, creatinine; Crtn, creatine; Tau, taurine; Tart, tartrate; Lact, lactose; Malt, maltose; Carn, carnitine; Actn, acetone; Ala, alanine; Leu, Leucine; ILeu, isoleucine; Val, valine.

