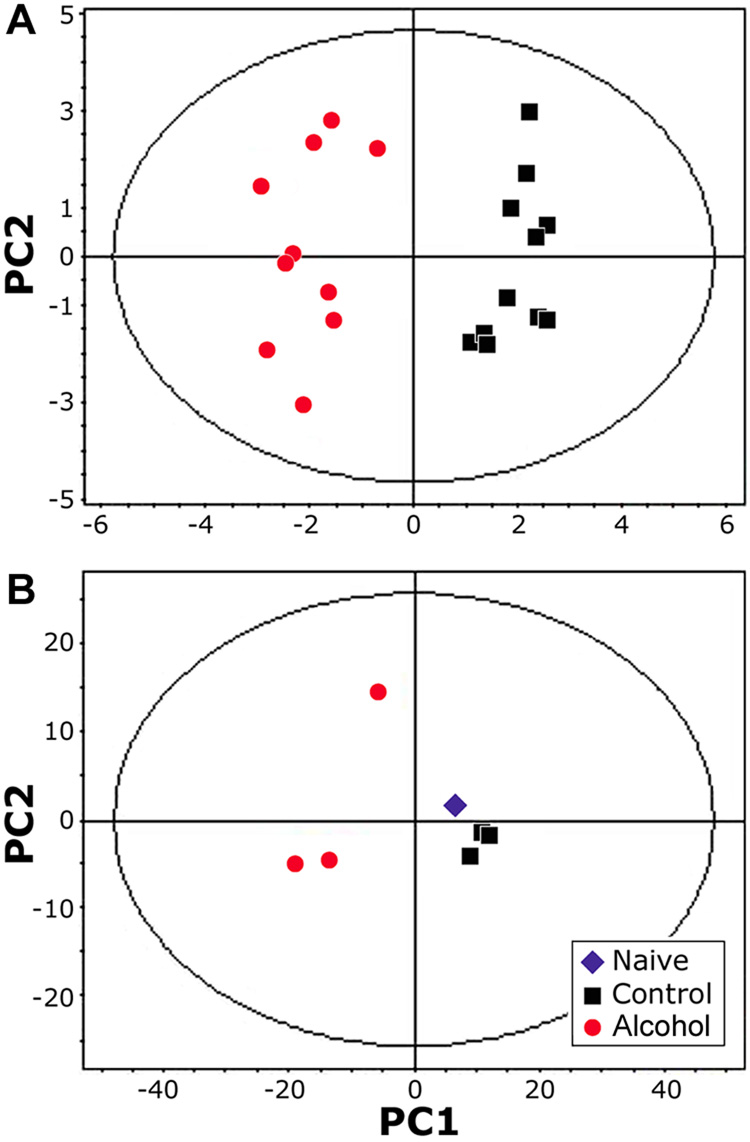
Figure 3.
Principal components analysis of the 1H NMR spectra from (A) urine (n=4, samples were collected on days 22, 30 and 36); and (B) liver (n=3 for high fat control and alcohol, samples were collected on day 28). Each point represents and individual measurement. In the urine spectra, alcohol and its main metabolite, ethyl-glucuronide, were removed from the analysis.

