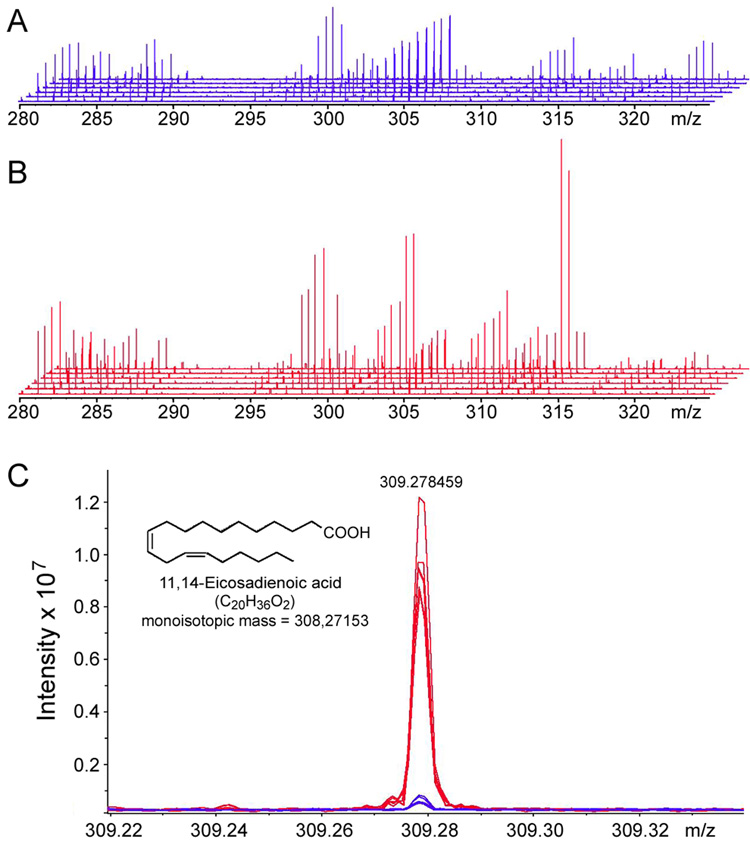
Figure 4.
FTICR-MS analysis of liver metabolome identifies molecules affected by alcohol in the mouse. Expansion of the ~40 Da m/z window (from ~280 to ~330 m/z) in FTICR-MS spectra obtained from six high-fat control (A) and six alcohol-treated (B) liver samples. (C) Expansion of the m/z range from 309.22 to 309.32 showing overlaid FTICR-MS spectra from samples depicted in A and B. Four metabolites were found within this 0.10 Da window and 11, 14-eicosadienoic acid (m/z 309.278459) could be identified on the basis of accurate mass and it is elevated in liver after alcohol treatment.

