
FIG. 3.
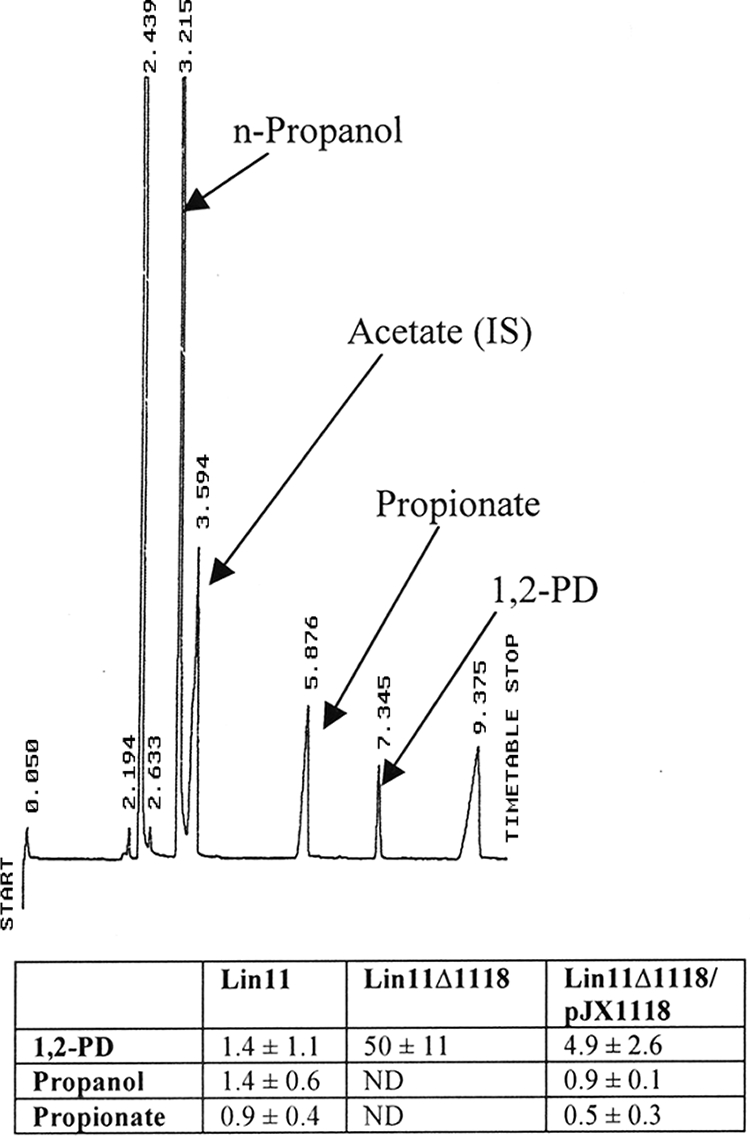
Gas-liquid chromatography analysis of 1,2-PD metabolites in culture media. A representative chromatogram of medium composition obtained from the wild-type Lin11 strain grown for 48 h in HTM, 0.2% yeast extract, 20 nM vitamin B12, 52 mM 1,2-PD medium is shown. Peaks were separated using an Equity-1 capillary column, identified by using commercially available standards, and quantified by using 1 mg of acetate as the internal standard (IS). Numbers above each peak are on-column retention times in minutes. Note that while peak areas are proportional to metabolite concentrations, the detector response factors differ for each compound, and thus, the relative peak heights do not mirror the relative concentrations listed in the table. Values for metabolite concentrations in culture media are expressed as mM for the three strains and are reported as means ± standard deviations (n = 3) in the table. In all cases, metabolite concentration values for the deletion and complementation strains differed significantly from those in Lin11 (P < 0.01). The peak eluting at 2.439 min is ethanol, which is derived from the solvent used for the addition of lipoic acid to HTM medium. ND, not detected, indicating that concentrations are at least 50-fold lower than that observed for the Lin11 strain.