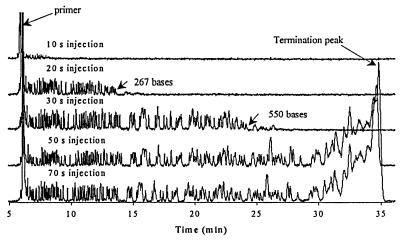
Figure 2.
Effect of injection times on steady injection states of DNA fragments of different sizes. The arrows point to the last peaks that reached steady injection states. The separations were performed at ambient temperature by using 4% LPA and an electric field strength of ca 0.180 V/cm for injection and separation. Four-color sequencing samples were used but only the data for T-terminated traces are presented. The data shown were obtained from a channel with an effective separation distance of 7.46 cm.

