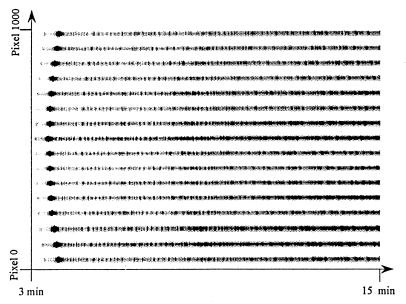
Figure 4.
A typical raw image of the sequencing separation results on a 16-channel chip. Only the image from 2.4 min to 10.6 min is presented. Two axes were introduced for the data collection process (see Experimental Procedures). megabace sequencing standard samples and an injection time of 50 s were used for the separation. All other conditions are as in Fig. 3.

