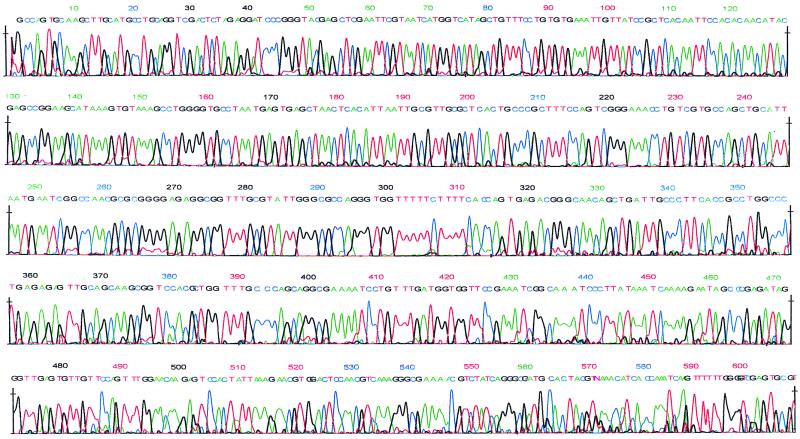
Figure 5.
A analyzed four-color sequencing electropherogram. The called bases were numbered automatically by the base-calling program. Because of the missing bases after the primer peak, the numbering in this figure does not match the actual base number mentioned in the Discussion section about Fig. 4. The electropherogram represented the data of the fourth (from the bottom) channel of Fig. 4.

