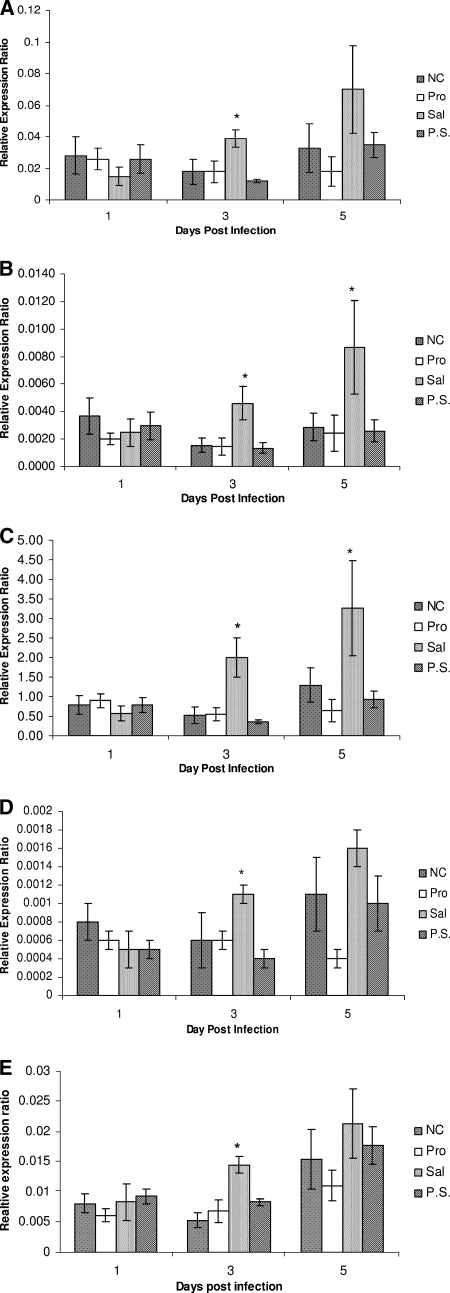
FIG. 1.
Relative expression levels of AvBD1 (A), AvBD2 (B), AvBD6 (C), AvBD4 (D), and cathelicidin (E) in the cecal tonsils of chicks. The treatment groups were as follows: the negative control (NC; no probiotic treatment, no Salmonella infection), the probiotic-treated group (Pro), the Salmonella-infected group (Sal), and the probiotic-treated and Salmonella-infected group (P.S.). Target gene expression is presented relative to β-actin expression and normalized to a calibrator. Error bars represent standard errors of the means. The differences in gene expression among groups at each time point were tested by Duncan's new multiple range test and were considered significant at P values of ≤0.05 (*).

