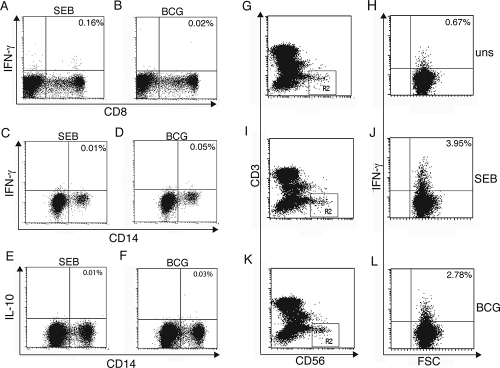
FIG. 2.
(A to F) Dot plots for whole cord blood samples showing intracellular IFN-γ responses (y axis) within CD8+ T cells (x axis) (A and B) and CD14+ cells (x axis) (C and D) and intracellular IL-10 responses (y axis) within CD14+cells (x axis) (E and F) following SEB stimulation or BCG stimulation. (G to L) Dot plots for the assessment of ICC IFN-γ production (y axis) within NK cells. Panels G, I, and K are dot plots for whole cord blood samples with CD3 (y axis) and CD56 (x axis) to enable the evaluation of NK cells (CD3− CD56+); only 1% of cells are represented, as 8 to 10 million cells were acquired for >15,000 gated events to be obtained. (H, J, and L) NK cells were selected in gate R2, and the ICC IFN-γ responses (y axis) within NK cells are shown; 100% of cells are represented. The unstimulated (uns) ICC IFN-γ NK cell response (H) and the responses to stimulation with SEB (J) and BCG (L) are indicated. The percentages in the upper right corners of the dot plots are frequencies of positive cells. FSC, forward scatter.

