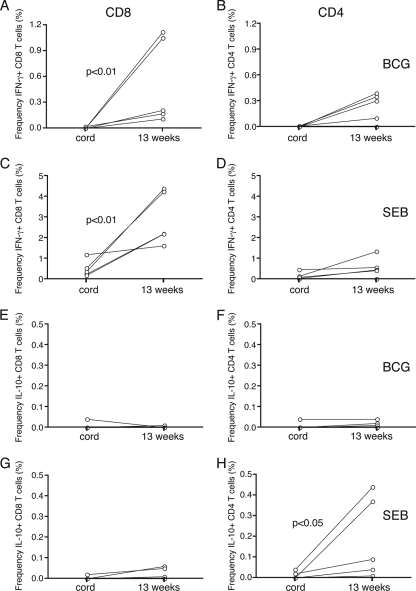
FIG. 5.
IFN-γ ICC and IL-10 ICC responses in the cord blood and the peripheral blood samples obtained from the same infants at 13 weeks of age. (A, B, E, and F) The IFN-γ responses in CD8+ T cells (A) and CD4+ T cells (B) and the IL-10 responses in CD8+ T cells (E) and CD4+ T cells (F) in peripheral blood samples compared to those in cord blood samples following stimulation with Danish BCG (MOI, 3.6:1) are indicated. (C, D, G, and H) The IFN-γ responses in CD8+ T cells (C) and CD4+ T cells (D) and the IL-10 responses in CD8+ T cells (G) and CD4+ T cells (H) compared to those in cord blood samples following stimulation with SEB (10 μg/ml) are similarly indicated. There was a significant difference between cord blood and 13-week blood samples for CD8+ IFN-γ+ cells (P < 0.01) following BCG stimulation (A) and for CD8+ IFN-γ+ cells (P < 0.01) (C) and CD4+ IL-10+ cells (P < 0.05) (H) following SEB stimulation, as indicated. Results are expressed as frequencies (in percentages) of cells expressing cytokine, following the deduction of the unstimulated response. Please note the use of different scales in the graphs.

