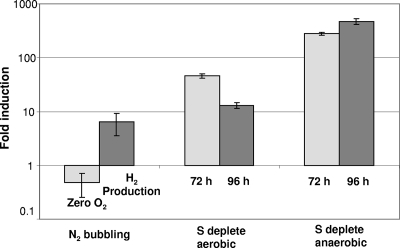
FIG. 4.
Induction ratios of LHCBM9 in C. reinhardtii CC124 following anaerobiosis by N2 bubbling in comparison to sulfur depletion under aerobic or anaerobic conditions. N2 bubbling, transcripts measured at zero O2 production and under anaerobic H2 production conditions; S deplete aerobic, S-depleted cultures bubbled with air to maintain aerobic conditions; S deplete anaerobic, anaerobiosis (microoxic conditions) induced by S depletion. Transcript levels were determined by qRT-PCR and compared to T0 from two to three independent biological replicates (shown are averages ± the standard error; hours show time after S depletion).

