FIG. 1.
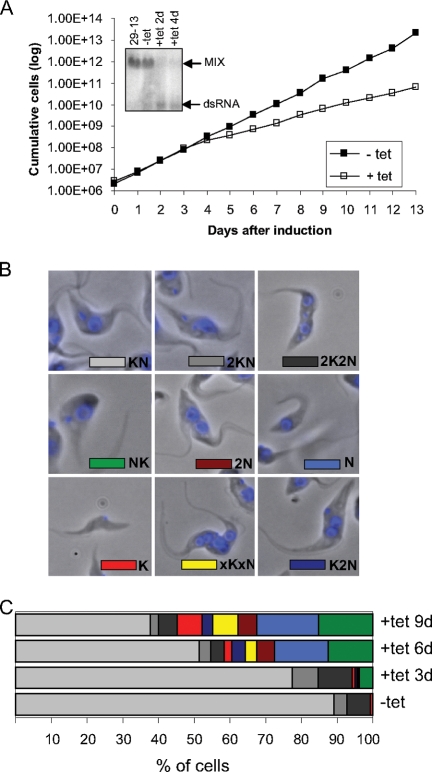
RNAi of MIX inhibits cell growth, and cells display abnormalities in the number and distribution of nuclei and kinetoplasts. (A) Growth effect. The numbers of noninduced cells (filled squares) and RNAi-induced cells (open squares) were plotted logarithmically as the product of cell density and total dilution. The levels of MIX mRNA were analyzed by blotting 10 μg of total RNA extracted from the 29-13 cell line, noninduced (−tet) cells, and induced (+tet) cells (days 2 and 4 after induction of RNAi). The positions of the targeted mRNA and the double-stranded RNA (dsRNA) synthesized following induction are indicated on the right. (B) DAPI staining was used to visualize various nucleus/kinetoplast (NK) phenotypes. (Top) Normal cells in G1/S and G2/M phases and undergoing cytokinesis. (Middle) Abnormal position of kinetoplast in the cell and cells without kinetoplast (dyskinetoplast cells). (Bottom) Example of a zoid (cell without nucleus) and abnormal cells with more than two nuclei. (C) Quantification of the results based on the number of nuclei and kinetoplasts in more than 200 cells per each time point.

