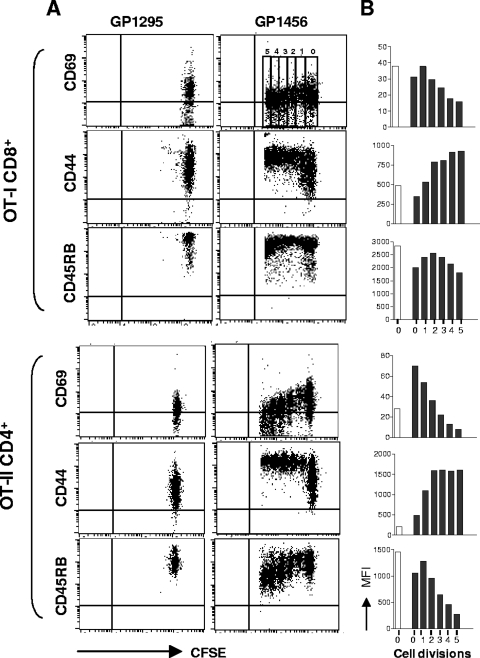
FIG. 4.
Phenotypic analysis of proliferating OT-I CD8+ and OT-II CD4+ T cells. The expression of CD69, CD44, and CD45RB was analyzed as a function of cell division on OT-I CD8+ and OT-II CD4+ T cells from cervical lymph nodes 3 days after immunization with recombinant vaccine strain GP1456 or control strain GP1295. (A) Dot plot analysis of CFSE dilution (x axis) versus CD69, CD44, or CD45RB expression (y axis) on OT-I CD8+ (top panels) and OT-II CD4+ (bottom panels) T cells following treatment with control (GP1295, left panels) or vaccine strain (GP1456, right panels). (B) MFI of CD69, CD44, and CD45RB expression per each cell generation of OT-I CD8+ (top panels) and OT-II CD4+ (bottom panels) T cells from mice immunized with control (GP1295, open histogram bars) or vaccine strain (GP1456, filled histogram bars). Cell divisions (from 0 to 5) are identified by CFSE intensity dilution, as shown in the upper right portion of panel A. Phenotypic analyses were performed with cells pooled from six animals. Results are representative of two separate experiments.

