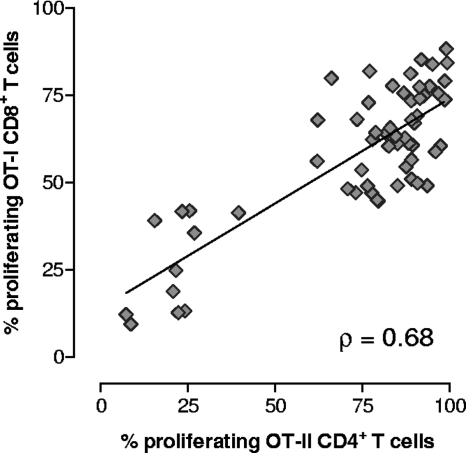
FIG. 6.
Correlation between OT-I CD8+ and OT-II CD4+ T-cell proliferation in each animal. Transgenic OT-I CD8+ and OT-II CD4+ T cells were adoptively cotransferred into C57BL/6 mice, and then the mice were immunized with recombinant S. gordonii. The percentages of proliferating OT-I CD8+ (y axis) and OT-II CD4+ (x axis) T cells detected in each animal at various time points are shown. The Spearman rank correlation coefficient (ρ) and regression line are shown.

