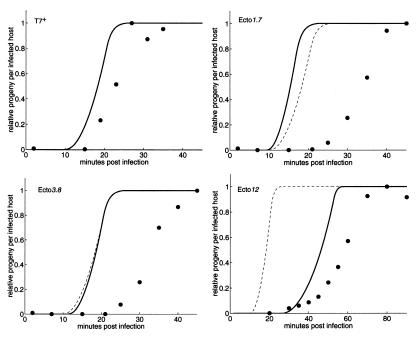
Figure 2.
Computed (solid lines) and observed (●) intracellular one-step growth curves for T7+ and the ectopic gene 1 strains. Both computed and experimental data are normalized to the maximum burst for each strain (simulation: 181; experimental: T7+, 103; ecto1.7, 75; ecto3.8, 102; ecto12, 107) to account for observed variations in DNA packaging efficiency (see Materials and Methods). Note the different time scale for ecto12. The computed T7+ one-step growth curve (dashed lines) is provided for reference.

