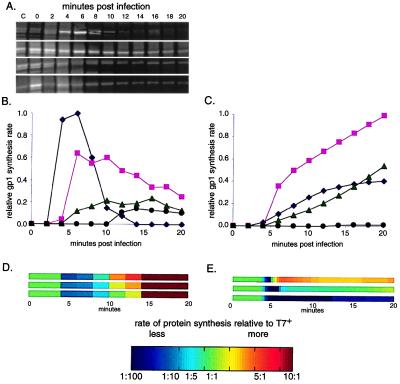
Figure 3.
(A) Observed, by pulse–chase labeling experiments, synthesis of T7 proteins. Synthesis of T7 RNA polymerase (gp1) is shown here; top to bottom, T7+, ecto1.7, ecto3.8, ecto12. (B) Observed gp1 protein synthesis from A normalized to reflect differences between gels; T7+ (⧫), ecto1.7 (■), ecto3.8 (▴), and ecto12 (●). (C) Computed gp1 protein synthesis (symbols as in B). (D and E) Observed (D) and computed (E) protein synthesis rates scaled relative to T7+ (see Materials and Methods) to compare changes between the ectopic strains and T7+; top to bottom, ecto1.7, ecto3.8, and ecto12.

