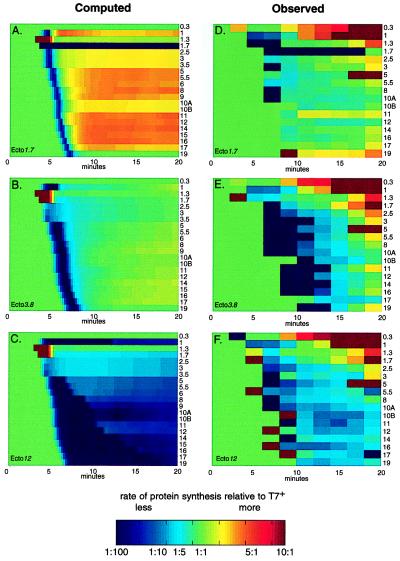
Figure 4.
Protein synthesis rates for the ectopic gene 1 strains relative to wild-type rates (see Fig. 3 legend and Materials and Methods). Computed and observed relative synthesis rates are given in the left and right columns, respectively. From top to bottom the plots show data for ecto1.7, ecto3.8, and ecto12, respectively. Proteins are identified by number on the right side of each row.

