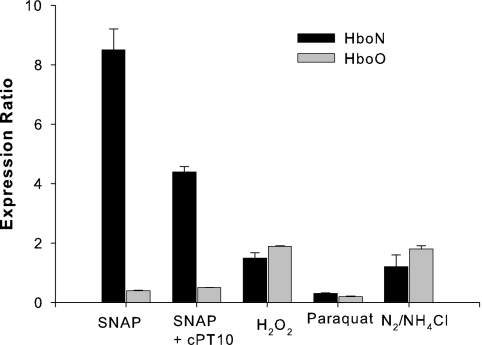
FIG. 3.
Transcriptional analysis of hboN and hboO gene expression in Frankia strain CcI3 using qRT-PCR. The expression ratio reflects the expression of each gene under the environmental stimulus relative to the expression under control conditions (with no stimulus). The error bars show the standard deviations.

