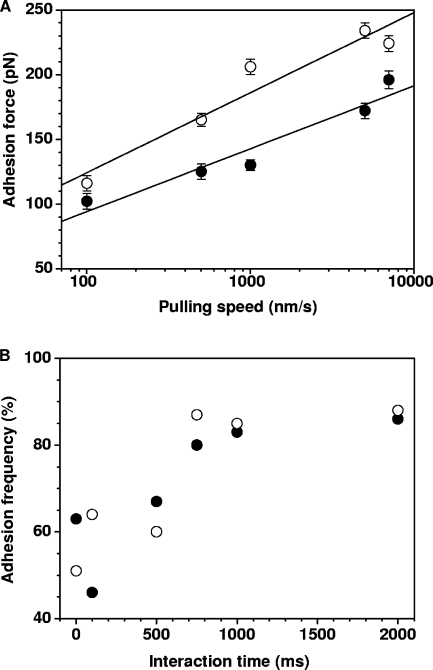
FIG. 4.
Dynamics of the HBHA-actin interaction. (A) Plot of the adhesion force measured between actin and HBHA having either their N-terminal (closed symbols) or C-terminal (open symbols) ends exposed, as a function of the logarithm of the pulling speed applied during retraction, while keeping the interaction time (500 ms) and the approach speed (1,000 nm s−1) constant. Data represent the mean of 512 measurements, as well as the standard error of the mean. (B) Plot of the binding frequency as a function of the interaction time measured at a constant approach and retraction speed of 1,000 nm s−1. Data represent the mean of 512 measurements.

