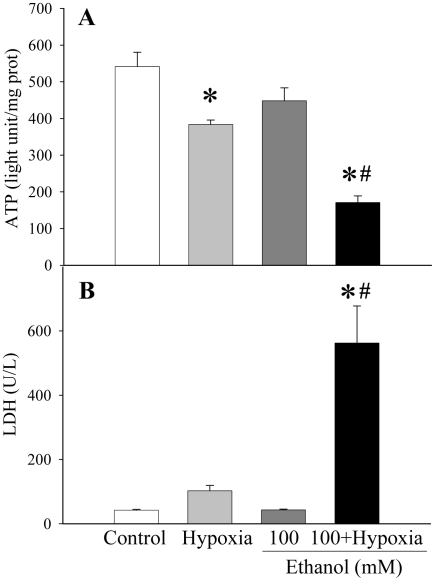
Figure 3.
Alterations in cellular ATP and supernatant LDH levels in H-4-II-E cells. A. Cellular levels of ATP were assayed from H-4-II-E cells treated with hypoxia (1% O2) alone, 100 mM ethanol alone, or combination of both for 24 h. B. Supernatant levels of LDH were measured from H-4-II-E cells with hypoxia (1% O2) alone, 100 mM ethanol alone, or combination of both for 24 h. Data is presented as mean ± SE (n=6-8) and compared by one-way ANOVA and Tukey's test: *P<0.05 versus control group; #P<0.05 versus hypoxia alone or 100 mM ethanol only group.

