FIG. 1.
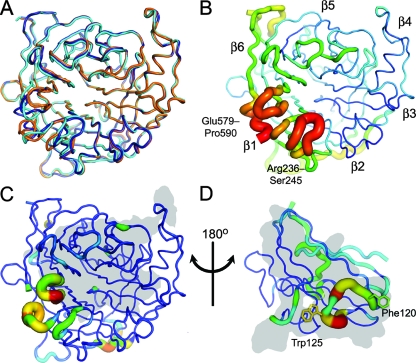
Crystal structure of apo-NiV-G reveals an induced-fit mechanism for EFNB2 binding. (A) Cα trace of apo-NiV-G (orange, chain A; dark blue, chain B) superimposed with NiV-G of the NiV-G-EFNB2 complex (cyan; PDB accession number 2VSM [7]). (B) Relative B-factor values (ramped from blue to red) mapped onto the Cα trace structure of apo-NiV-G (chain B). Mobile regions have a thick radius and are colored red (high B-factor), while ordered regions have a thin radius and are colored blue (low B-factor). The β-propellers are numbered according to standard nomenclature (7, 14, 37, 60). (C) RMS displacement of equivalent residues between apo-NiV-G (average of chains A and B) and EFNB2-bound NiV-G mapped onto Cα trace structure of apo-NiV-G (chain B). The tube radius and color of the trace represent the RMS displacement (ramped from blue to red). Regions with high deviations between apo and EFNB2-bound forms are thick and colored red, while regions with low deviation are thin and colored blue. The gray region indicates the surface of the protein that interacts with EFNB2. (D) RMS displacement between NiV-G bound EFNB2 and the other reported EFNB2 structures mapped onto the Cα trace structure of NiV-G-bound EFNB2 (average of apo-EFNB2 [55], EPHB2-EFNB2 [30], and EPHB4-EFNB2 [11]; colored as in panel C). The gray region indicates the surface of the protein that interacts with NiV-G.

