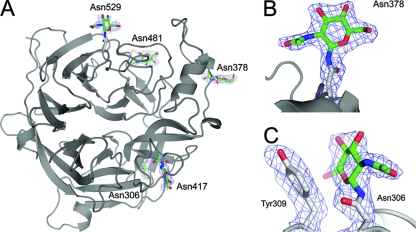
FIG. 3.
NiV-G N-linked glycosylation sites. (A) Cartoon representation of NiV-G (chain B) with GlcNAcβ1-Asn structures shown in sticks. The carbons of GlcNAc are shown in green, while those of side chains are colored gray. Oxygen atoms are colored red, and nitrogen atoms are blue. A simulated annealing electron density omit map calculated in the absence of carbohydrate is displayed around the GlcNAc residues contoured at 1σ. (B and C) Enlarged views of the GlcNAc residue at Asn378 (B) and the GlcNAc residue at Asn306 (C); the omit map was calculated in the absence of carbohydrate and Asn378, Asn306, and Tyr309.

