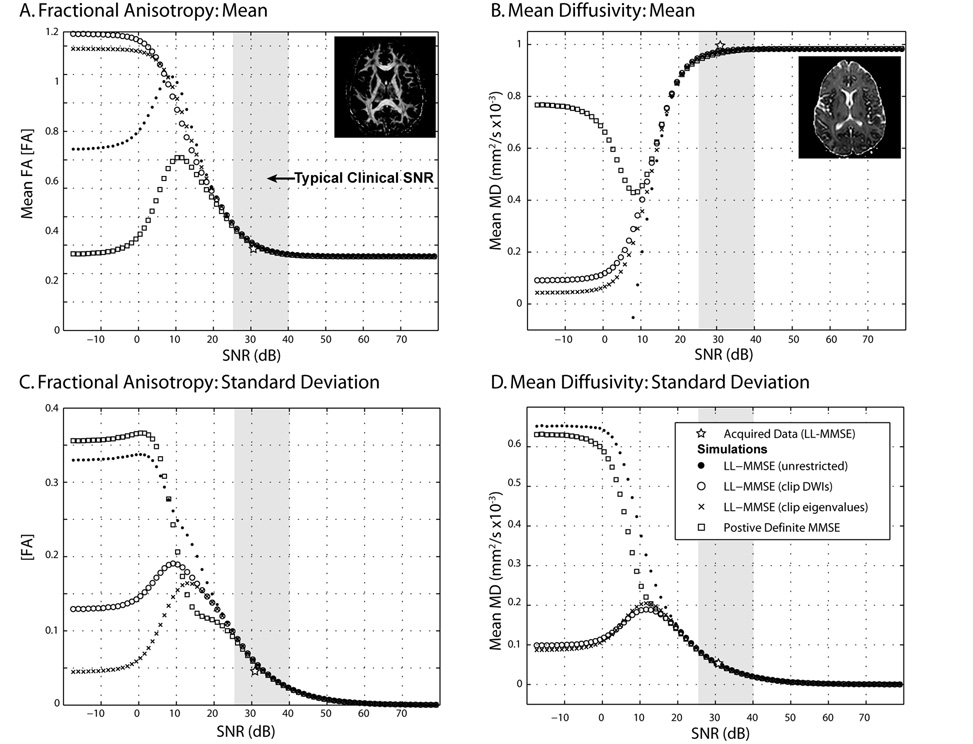
Figure 2.
Simulated contrasts by SNR with tensor fitting method. Both the FA (left) and MD (right) exhibit substantial non-monotonic bias (top row) and variability (lower row) with SNR. Symbols show the within-slice mean FA (Panel A), mean MD (Panel B), standard deviation of FA (Panel C), and standard deviation of MD (Panel D) using the indicated tensor fitting method on 50 data sets with a given SNR on the minimally weighted (b0) image. Inlaid images show the high SNR contrasts derived with the LL-MMSE method. Gray region shows an approximate range of mean SNR on the representative b0 slice.

