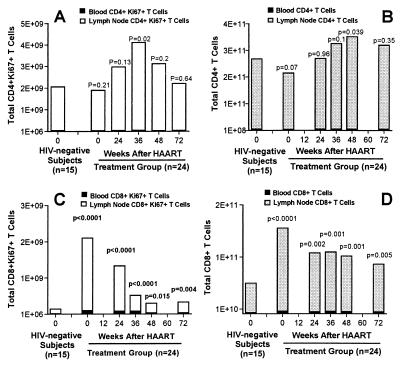
Figure 4.
Kinetics of proliferating CD4 and CD8 T cells following long-term HAART. (A) Changes in the total (blood plus lymph node) number of proliferating, Ki67+, CD4 T cells. (B) Changes in the total (blood plus lymph node) number of CD4 T cells. (C) Changes in the total (blood plus lymph node) number of proliferating, Ki67+, CD8 T cells. (D) Changes in the total (blood plus lymph node) number of CD8 T cells. Differences in the means between HIV-negative and HIV-positive subjects were compared by the F-test and Student's t test after taking the logarithm of the data.

