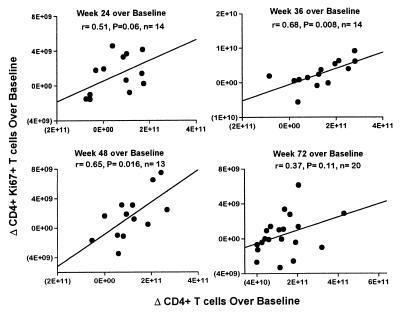
Figure 5.
Correlations between changes in the total body number of proliferating and total body number of CD4 T cells at different time points after initiation of HAART. Δ corresponds to the differences in the number of proliferating (Ki67+CD4+) T cells and of total CD4 T cells between baseline and weeks 24, 36, 48, and 72 after HAART. Correlation was tested by Pearson's test.

