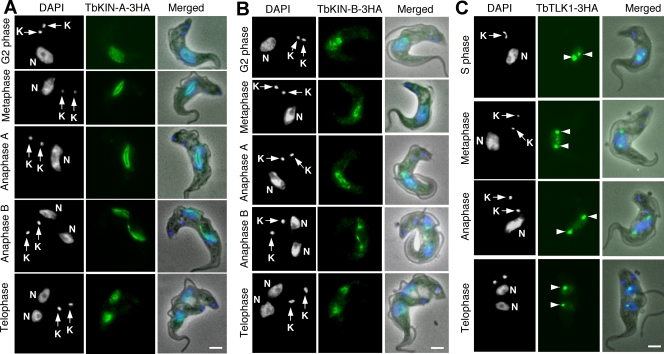
Figure 6. Subcellular localizations of TbKIN-A, TbKIN-B and TbTLK1 in the bloodstream trypanosomes.
Cells expressing 3HA-tagged TbKIN-A (A), TbKIN-B (B), and TbTLK1 (C) proteins to the endogenous levels were fixed, stained with FITC-conjugated anti-HA antibody, and counterstained with DAPI for nucleus (N) and kinetoplast (K). Percentages of cells at different cell cycle stages were determined from samples of about 500 cells. For cells expressing TbKINA-3HA or TbKIN-B-3HA, the distributions were as the following, respectively; G2 phase (10%, 9%); metaphase (8%, 7%); anaphase A (7%, 6%); anaphase B (8%, 10%); telophase (6%, 7%), whereas the G1 phase (53%, 54%) and S-phase (8%, 7%) cells did not have detectable TbKIN-A-3HA or TbKIN-B-3HA. The TbTLK-3HA cells had S phase (12%); metaphase (8%); anaphase (11%) and telophase (6%) cells expressing the protein but the G1-phase cells (63%) did not express TbTLK1-3HA. The arrowheads point to the two focal spots at the likely spindle poles. Bars: 2 µm.

