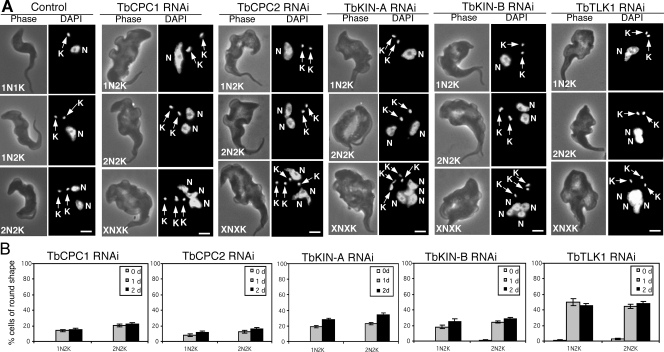
Figure 8. Morphology of the control and knockdown bloodstream cells after RNAi induction.
(A). Control cells and cells after RNAi induction for 48 hrs were fixed with 4% paraformaldehyde, stained with DAPI for nucleus (N) and kinetoplast (K), and examined under fluorescence microscope. Bars: 2 µm. (B). Percentages of round-shaped cells after RNAi silencing of TbCPC1, TbCPC2, TbKIN-A, TbKIN-B and TbTLK1 for 24 and 48 hrs. About 200 cells were counted in each sample and the data represent three independent experiments.

