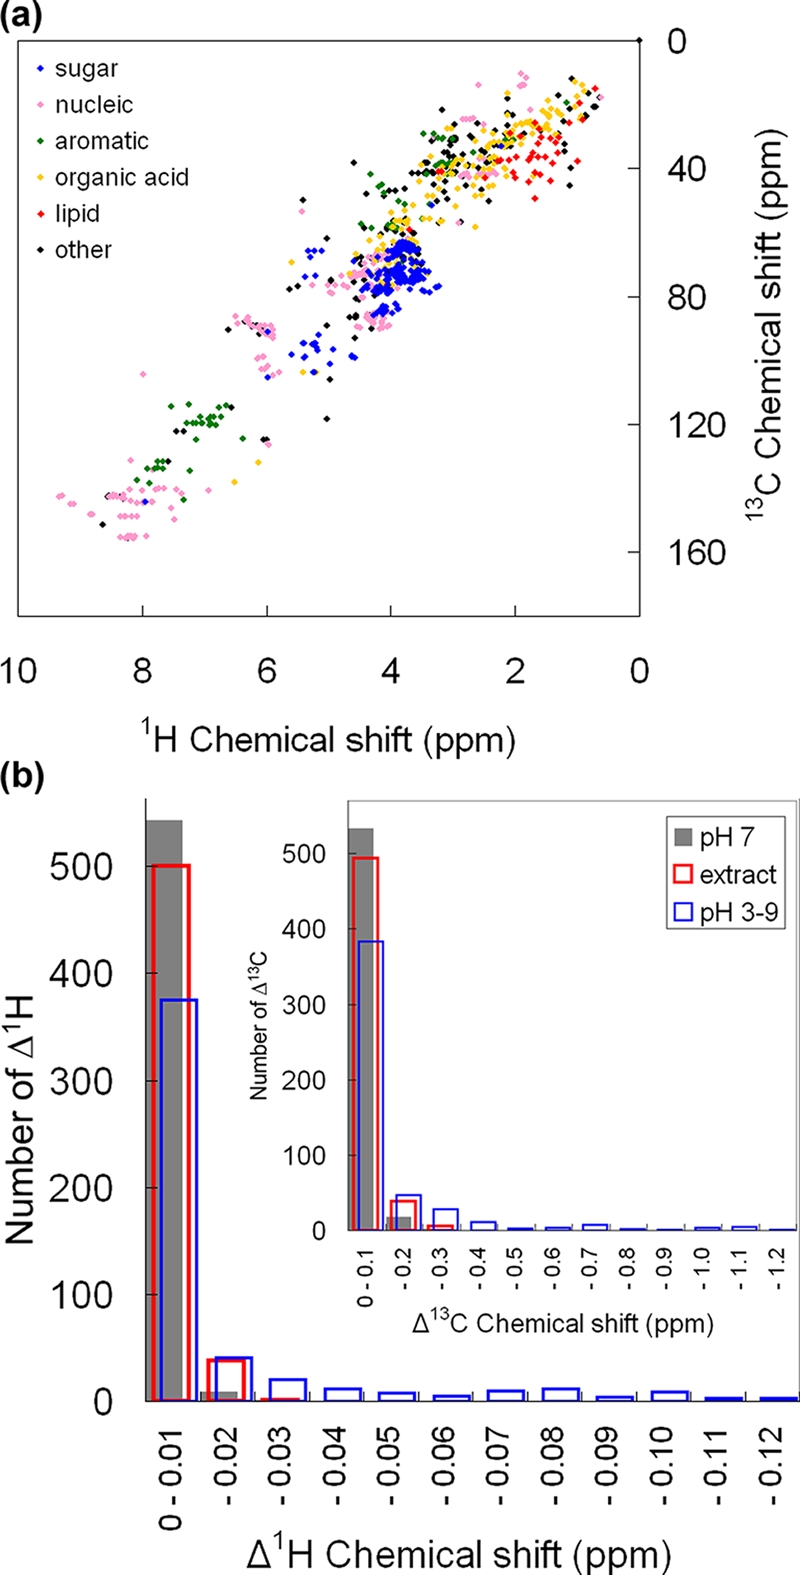
Figure 1. HSQC-based metabolite chemical shift database.

(a) 1018 HSQC peaks derived from 142 metabolites compiled in the database are displayed as sugars (blue), nucleic acids (pink), metabolites having aromatic rings (green), organic acids (orange), lipids (red), and other metabolites (black). (b) The robustness of the database was tested statistically in terms of both 1H and 13C (upper right) chemical shifts (Δ1H and Δ13C, respectively). Chemical shift fluctuations of reference compounds (16 proteinogenic amino acids, glucose, succinate, and fumarate) with T87 crude extracts (red, 539 chemical shifts) were small enough to be used as representative chemical shifts for comparison with database records. Chemical shifts of reference compounds without added extracts are shown in gray (553 chemical shifts). In contrast, the chemical shifts of reference compounds at different pHs (blue, 525 chemical shifts) fluctuated over a wider range (compare blue and gray bars). A chemical shift fluctuation was defined as the difference from the average of the chemical shifts without added extracts.
