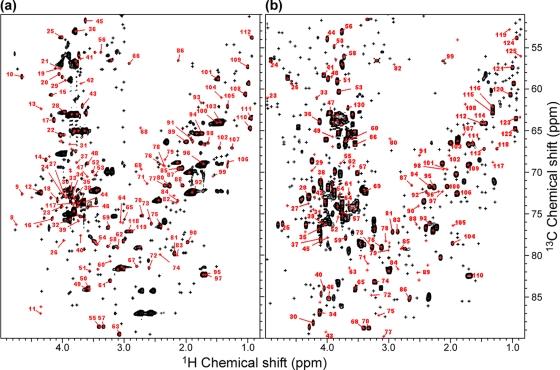
Figure 2. Metabolite identification using the HSQC-based metabolite chemical shift database.
(a) A total of 453 peaks were detected in the B. mori HSQC spectrum, of which 174 had candidate matches in the database (red), and 119 were uniquely identified (no more than one candidate match, numbered in red; see Table S1 for the metabolite names), and 279 had no candidate matches (black). The spectrum was acquired with 2048 points per 16 ppm of 1H, 32 transients per free induction decay, and 160 increments per 40 ppm of 13C. (b) A total of 544 peaks were detected in extracts from T87 cultured cells, of which 192 had candidate matches in the database (red) and 124 were uniquely identified (numbered in red; see Table S1), and 352 had no candidate matches (black). The spectrum was acquired with 1024 points per 16 ppm of 1H, 32 transients per free induction decay, and 200 increments per 40 ppm of 13C.

