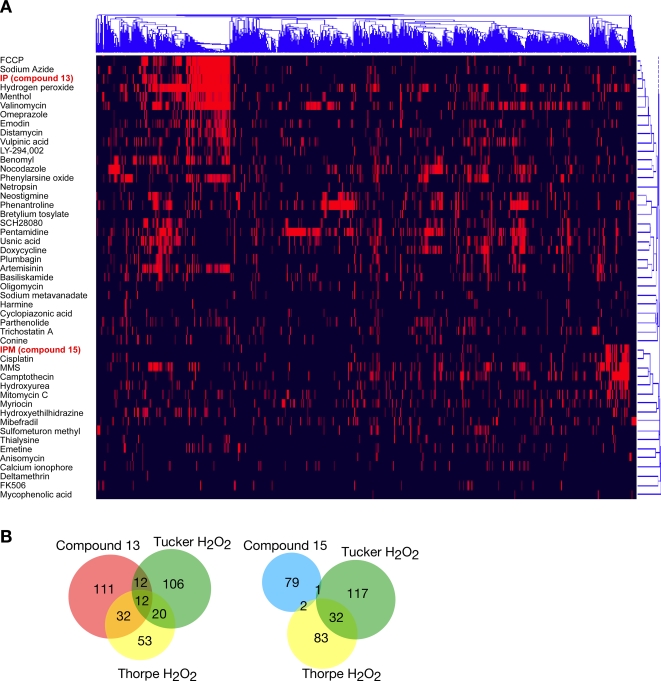
Figure 3. Two-dimensional hierarchical clustering of compounds 13 and 15 with the chemical-genetic profiles of a compendium of 102 compounds and extracts.
A. 3418 genes are plotted on the horizontal axis with the gene cluster tree across the top. Compounds are plotted on the vertical axis with the cluster tree on the right. Chemical-genetic interactions are represented as red lines. A portion of the cluster, with 46 compounds, is shown. B. Overlap between the compound 13 and the compound 15 profiles, and the profiles of H2O2 described in the literature [37],[38]. The Venn diagrams show the number of genes out of a possible 4944 non-essential genes that were identified as being sensitive to compound in each study.

