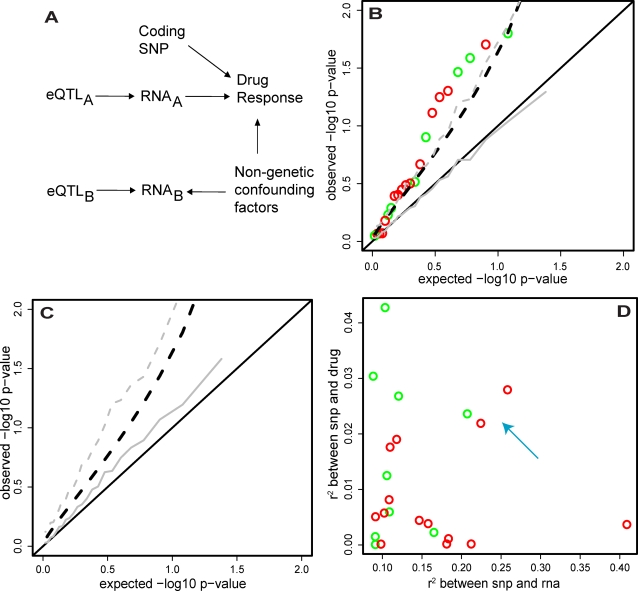
Figure 6. Effect of cis-eQTLs in drug-response correlated genes on drug-response.
The 198 unrelated individuals were ranked by RNA expression value for each of the 1000 “best-measured” genes. These individuals were then ranked by response (growth/ATP- corrected EC50) to each of the 5 assayed drugs. Rank-correlations (spearman's rho) were computed for each gene-X-drug pair (1000×5) and the drug with the strongest correlation to a given gene was “assigned” to that gene. The 202 genes whose strongest drug correlations exceeded rho2 = .05 (FDR<10%) were taken as “drug-response correlated” genes. If such a gene also had a cis-eQTL that explained at least 8% (FDR<10%) of its variance, the SNP-RNA-Drug relationship was considered in the foregoing panels. We considered 23 SNP-RNA-Drug response relationships (14 derived using WTSI RNA dataset+9 derived using the Broad Institute RNA dataset). (A) Diagram of different relationships between SNPs, RNA levels, and drug response. Coding SNPs have direct (non-RNA mediated) effects on drug response by altering protein function. No SNPs of this class were found at genome-wide significance in our GWAS scan. Changes in RNAA influences drug response. An eQTL for one of these RNAs (i.e. eQTLA) is thereby associated with drug response.Non-genetic confounding factors simultaneously influence RNAB levels and drug response; changes in RNAB do not influence drug response (this is the expected scenario for most RNAs). Even if levels of these RNAs are associated with eQTLs, these eQTLs are not associated with drug response. (B) For each SNP-RNA-Drug response relationship (WTSI – red, Broad – green) the drug response was regressed against the eQTL SNP genotype. P-values are plotted as open circles against their expectation under the null distribution. Black solid line indicates the theoretical flat uniform distribution expected under the null and black dashed line is the p = .05 one-sided significance threshold for deviation from the null. Grey lines show equivalent null parameters, but derived from a simulated dataset with the same SNP/RNA/Drug variances and independent SNP-RNA/RNA-Drug pairwise covariances as the real 23 SNP-RNA-Drug response relationships. Plot shows that the observed p-value distribution for drug-response regressed against RNA eQTL SNPs exceeds that expected by chance. (C) For each SNP-RNA-Drug response relationship, simulated datasets were created with the same SNP/RNA/Drug variances and RNA-Drug pairwise covariance as the real 23 SNP-RNA-Drug response relationships, but with the real SNP-RNA covariances replaced by r2 = 0.05. Then, only those simulations where the observed SNP-RNA association exceeded r2 = 0.08 were used to plot the median and p = .05 SNP-Drug p-value distributions as in (B) (again, grey solid and grey dashed lines, respectively). Black lines also as in (B). Plot shows that “winner's curse” in eQTL discovery leads to an inflation of SNP-Drug associations, in the absence of any RNA influence on Drug response. (D) For each SNP-RNA-Drug response relationship (WTSI – red, Broad – green), the correlation between SNP and RNA is plotted against the correlation between SNP and Drug. Most increased association between SNP and Drug response comes from the weaker eQTLs, while most of the stronger eQTLs have no association with drug response, consistent with the winner's curse phenomenon displayed in (C). Additionally, 3 SNP-RNA-Drug response relationships emerge that are both relatively strong SNP-RNA and SNP-Drug response associations, indicated by the light blue arrow.

