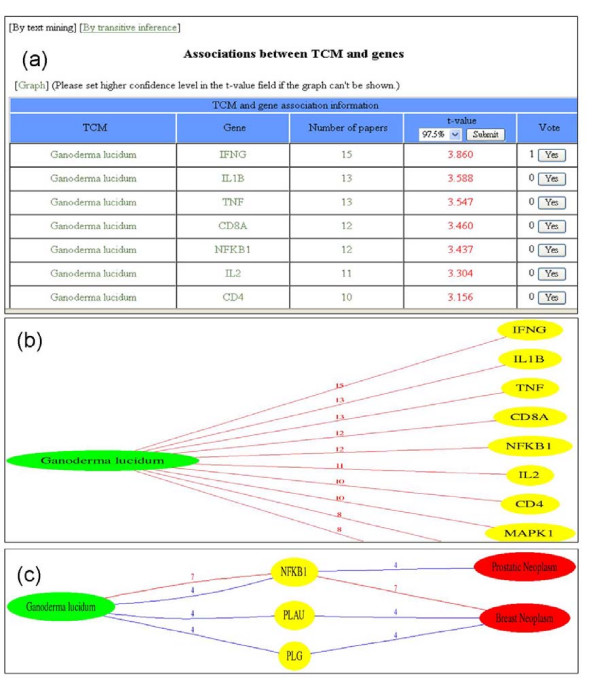
Figure 3.
The TCM and gene associations and visual information representations. (a) The Ganoderma lucidum and gene associations from text mining. Detailed information about TCM and genes could be accessed by following the links themselves. Literature evidences supporting the associations are available through following the links indicating the number of paper. Confidence thresholds are able to be selected. Users with domain knowledge can recommend the associations they think are correct. Moreover, TCM and gene associations could be discovered by transitive inference. (b) TCM and gene association graph. TCM and genes are represented by green and yellow nodes, respectively. The edges between them are colored according to t values (please see the text). The numbers on the edges mean how many literatures may support the associations. (c) TCM, gene and disease association graph. Red nodes mean diseases.

