Figure 6.
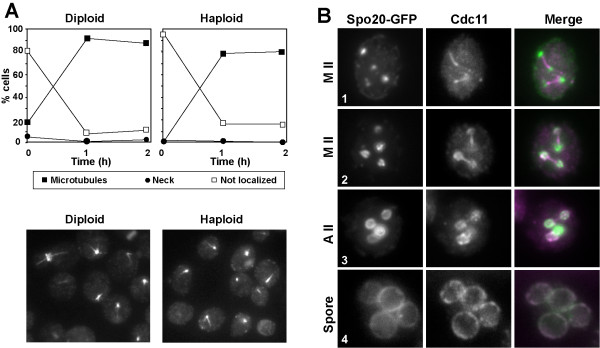
Temporal pattern of Cdc11 localization to microtubules. (A) AN120 diploid cells (left panel) or AN117-16D haploid cells (right panel) were grown in YPAcetate medium before transferring to sporulation medium. Aliquots were then taken at 0, 1 and 2 h and stained with anti-Cdc11 antibody. The graph shows the percentage of cells with different Cdc11 stainings: bud neck (black circles), microtubules (black squares) or not localized (white squares). At least 200 cells were counted. (B) Wild-type cells (AN120) carrying GFP-SPO2051–91 (plasmid pG20) were sporulated and stained with anti-Cdc11 and DAPI. Images of Spo20-GFP, Cdc11 and DAPI are shown. The merged image shows Spo20 (green) and Cdc11 (magenta). Colocalization is indicated in white. Metaphase II (1–2), anaphase II (3), or post-meiotic (4) cells are shown.

