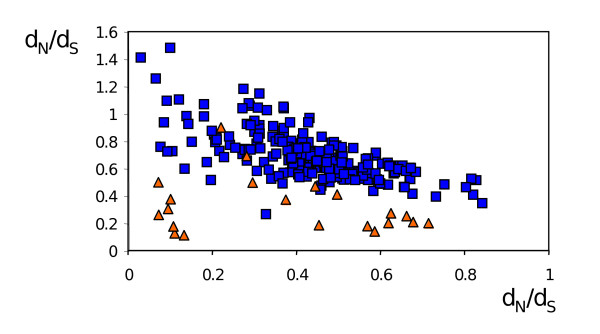
Figure 6.
dN/dS vs dS plots for PSA genes pairwise comparisons. DNA alignments covering the LRR domain were generated for each of the Chr5A, B, 9, 12, 21, 31A, B, C PSA gene clusters (including genes of all three Leishmania species; see Additional file 13 for alignment of Chr12 genes). After reducing very homologous genes (with dS<0.02) to single entities, dN/dS and dS values were calculated for all pairwise comparions inside a given cluster. Orange triangles: Chr5A, B, 9, 21, 31A, B, C clusters; blue squares: Chr12 cluster. Arrows point to values for L. major-L. infantum ortholog comparisons.

