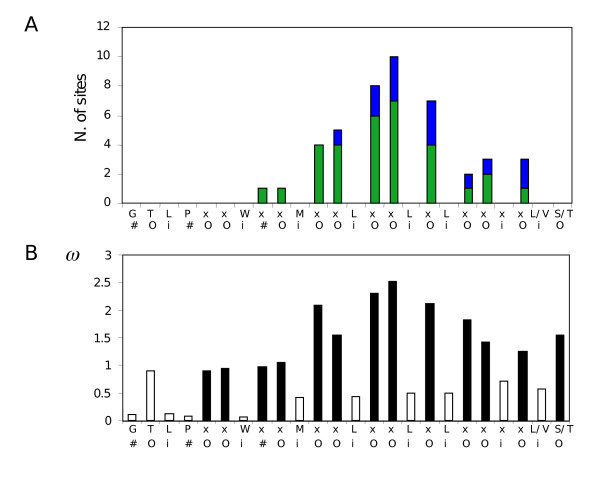
Figure 7.
Distribution of the predicted positively selected sites along the LRR amino acid consensus sequence. A) A DNA alignment covering the LRR domain plus the flanking N-ter and CGC-C2 domains of all Chr12 PSA genes (Additional file 16) was analysed by codeml. A) The predicted positively selected sites were plotted against their positioning in the LRR domain. Green bars represent the number of predicted positive sites with probabilities greater than 95% and blue bars, eventual increments when considering sites with probabilities greater than 90%. o, i and # refer to positions predicted to reside outside, inside or "in between" in the PSA LRR 3D structure. B) Means of dN/dS (ω) at each residue position in the LRR were calculated from the posterior dN/dS values of all sites sharing the same position in the LRR. Filled bars: variable residues; open bars: conserved residues.

