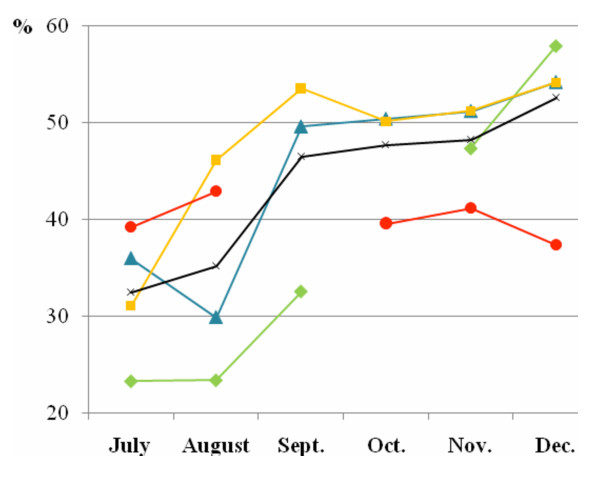
Figure 2.
Monthly incidence rates of uncomplicated malaria. Green, blue, yellow and red lines represent the monthly incidence rates of uncomplicated malaria (%) between July and December in 1998 (October excluded), 2000, 2001 and 2002 (September excluded) respectively. The black line represents the mean monthly incidence rates of uncomplicated malaria (%) from 1998 to 2002 (1999 excluded).

