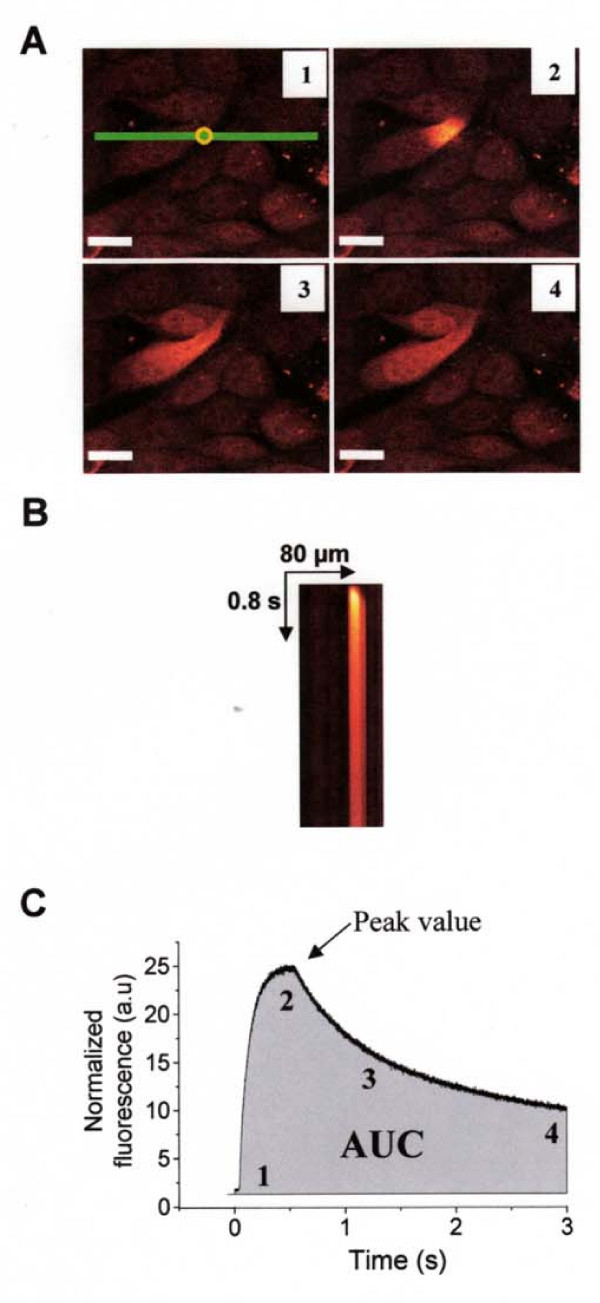
Figure 1.
Determination of localized Ca2+ mobilization by Ca2+ caged technique. A Confocal XY images illustrating Ca2+ release by photolysis of NP-EGTA molecule. The uncaging pulses were delivered with 5% of 405 nm diode for 500 ms with tornado scanning mode in a region of interest of 10 pixels diameter (yellow circle). Scale bars 25 μm. B XT images were obtained by acquisition in line scan mode (green line in A) during 3 s. C Typical intensity profile of Ca2+ variation was extracted from XT images presented in B, the grey area represents the measure of area under the curve (AUC). The number 1 to 4 represented the Ca2+ response induce by the photolysis at different time (in figure 1A and 1C). All the parameters automatically measured with a computer program developed in our laboratory under IDL 5.3 structured language were represented on the typical intensity profile (peak and kinetics parameters).

