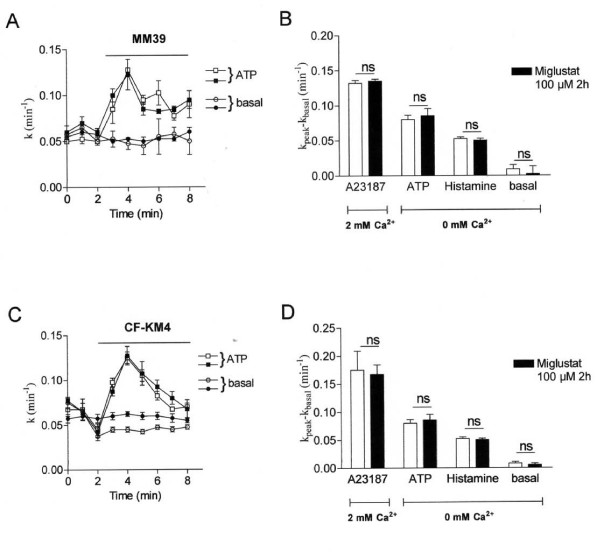
Figure 9.
ER Ca2+ release decreased after F508del-CFTR correction, what is the consequence on calcium-activated chloride channel (CaCC) activity? A Example of mean iodide efflux for activation of CaCC in miglustat-treated (black symbol) or not (open symbol) MM39 cells. CaCC were stimulated by 100 μM ATP in 0 mM Ca2+ bath medium. B Histograms show the mean relative rate for the experimental conditions (1 μM A23187, 100 μM ATP or 100 μM histamine) indicated below each bar (n = 4) in miglustat-treated (black bars) or not (open bars) MM39 cells. C Examples of mean iodide efflux for activation of CaCC in miglustat-treated (black symbol) or not (open symbol) CF-KM4 cells. CaCC were stimulated as for MM39 cells. D Histograms show the mean relative rate for the experimental conditions indicated below each bar (n = 4) in miglustat-treated (black bars) or not (open bars) CF-KM4 cells. Results are presented as mean ± S.E.M; ns, non significant difference.

