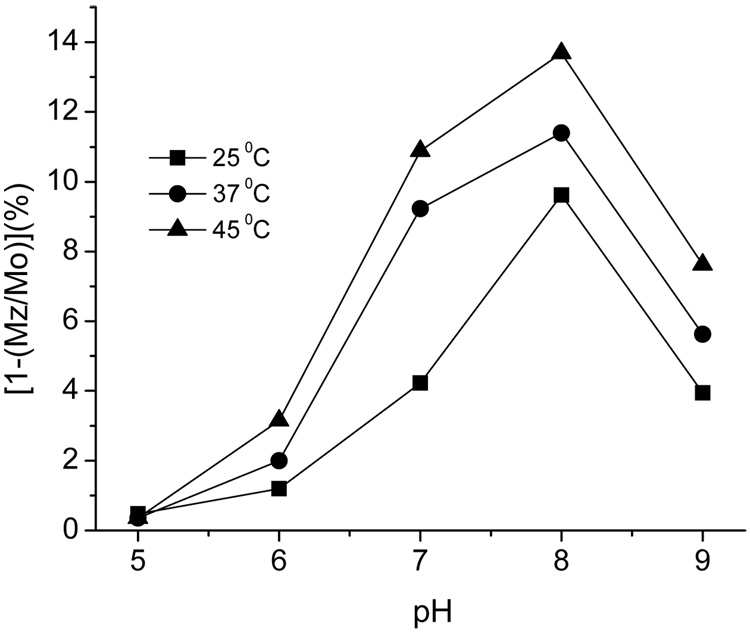
Figure 4.
The effect of pH and temperature on the PARACEST effect of 25 mM of 11a. PARACEST spectra were acquired using a Varian Inova 600 MHz NMR spectrometer with a modified presaturation pulse sequence that included a continuous wave saturation pulse, saturation pulse power of 31µT, saturation delay of 4 seconds at −51ppm and +51ppm.

