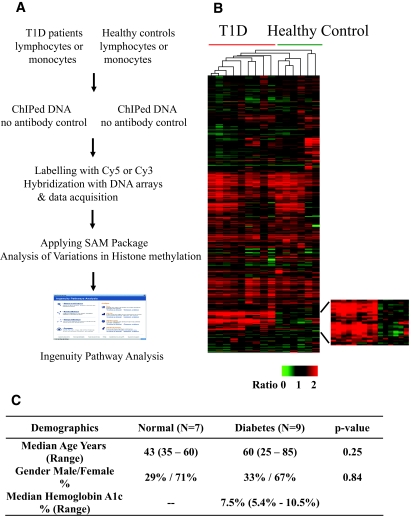
FIG. 1.
Profiling histone lysine methylation in blood cells from type 1 diabetic (T1D) patients versus healthy control subjects. A: The overall experimental design. B: Hierarchically clustered histone H3K9me2 profiles of lymphocyte samples from patients with type 1 diabetes and healthy control subjects (columns) and 10,053 probes (rows). Of the total 12,055 probes in the 12K cDNA array, 2,002 probe signal intensities were below the threshold limit of detection, and this yielded 10,053 probes. The region at the bottom showing clear differences in a subset of genes in type 1 diabetes is depicted in the enlarged section on the right. C: Demographics for the type 1 diabetic patients and healthy control subjects. SAM, significance analysis of microarrays. (Please see http://dx.doi.org/10.2337/db08-0645 for a high-quality digital representation of this figure.)

