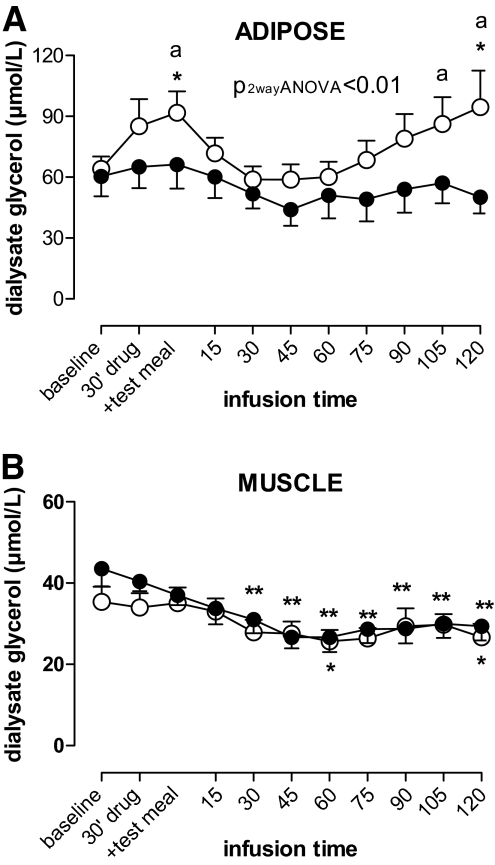
FIG. 3.
Changes in microdialysis subcutaneous abdominal glycerol concentration (A) and skeletal muscle glycerol concentrations (B) before and after ingestion after a test meal. On one day, subjects ingested the meal during a continuous ANP infusion; on another day, they ingested a meal during placebo (PLC) infusion. *P < 0.05 vs. baseline; **P < 0.01 vs. baseline; a, P < 0.05 ANP vs. placebo. ○, ANP; •, PLC.

