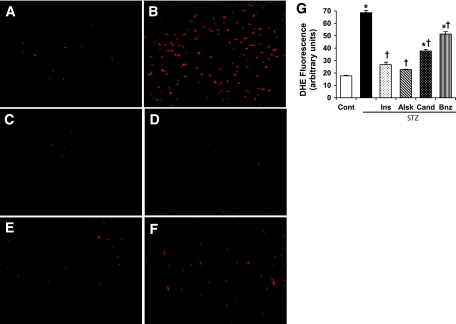
FIG. 3.
Measurement of oxidative stress in heart sections by DHE staining. These are representative images of DHE-stained heart sections from control rats (A); diabetic rats (B); and diabetic rats treated with insulin (C), aliskiren (D), candesartan (E), or benazepril (F). Magnification ×60. G: DHE fluorescence intensity was calculated from five images per heart and three hearts per group. Values are expressed as means ± SE (n = 15). *P < 0.05 vs. control, †P < 0.05 vs. diabetic rats without any treatment. (Please see http://dx.doi.org/10.2337/db08-0805 for a high-quality digital representation of this figure.)

