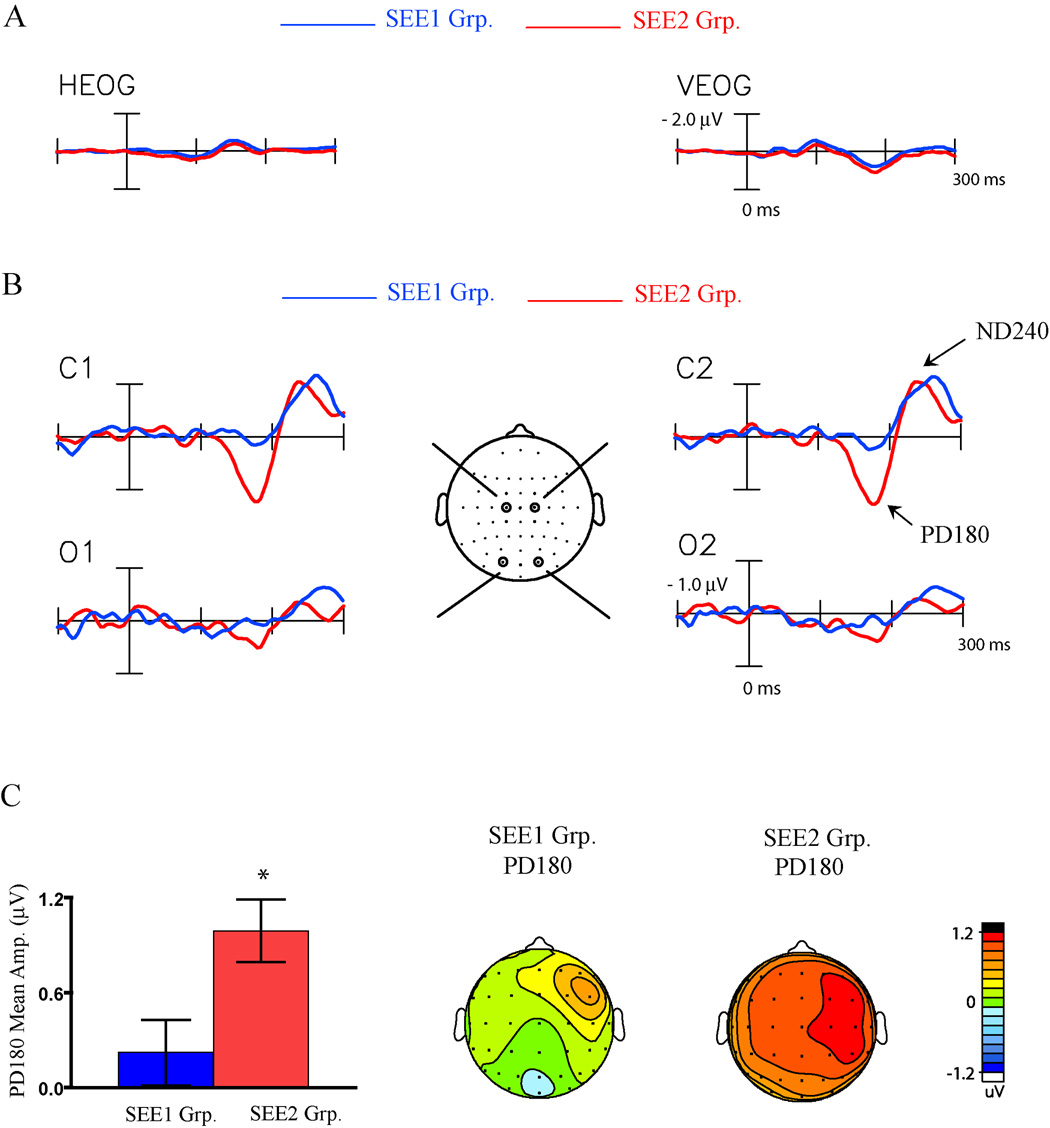
Figure 3.
ERP differences between the SEE1 and SEE2 groups. [A] Horizontal and vertical electro-oculograms (HEOG and VEOG) time-locked to the A1V1V2 stimulus and averaged separately for the SEE1 group (n=17) and the SEE2 group (n=17) [B] Fusion_Diff difference waves for the SEE1 and SEE2 groups. Recordings are from left and right central (C1, 2) and occipital (O1, 2) sites. [B] Bar graphs comparing the mean amplitude of PD180 in the 160–192 ms interval in the Fusion_Diff waveforms for the two groups, and voltage maps showing the topography of the PD180 component in the two groups.

