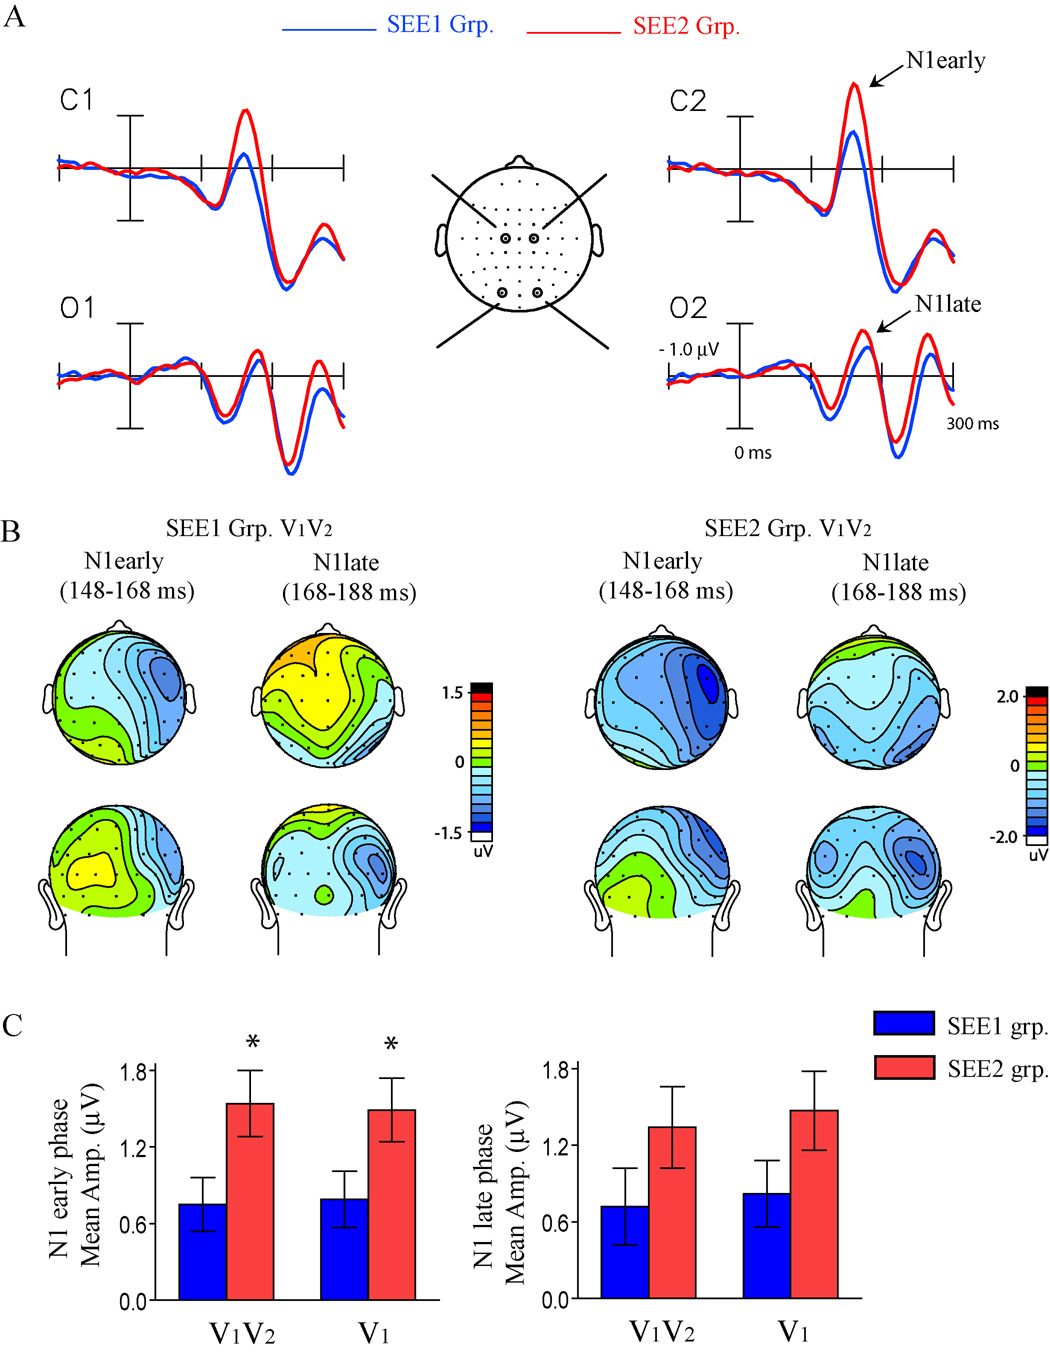
Figure 4.
ERP differences between the SEE1 and SEE2 groups for the V1V2 stimulus. [A] ERPs to V1V2 averaged separately for the SEE1 group and the SEE2 group. Recordings are from left and right central (C1, 2) and occipital (O1, 2) sites. [B] Voltage maps comparing the topography of the visual N1 component in its early and late phases between the two groups. [C] Bar graphs comparing the mean amplitude of the early and late phases of the N1 component between the two groups in the ERPs to both the V1V2 and V1 stimuli. ‘*’ denotes significant amplitude differences between groups as reported in the text.

