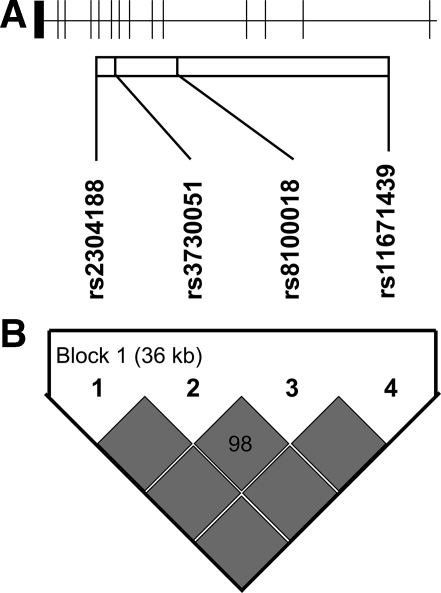
Figure 1.
Gene structure and LD plot for AKT2. A: The gene structure of AKT2 is shown; the gene has 14 exons and is located on the reverse strand of chromosome 19q13. The locations of the genotyped SNPs relative to the exons are indicated. B: The LD plot displays D′ values (percent) for each pair of SNPs in the box at the intersection of the diagonals from each SNP. D′ between each pair of SNPs was 1.0 (solid boxes) and was 0.98 between rs3730051 and rs8100018, indicating strong LD across the region.

