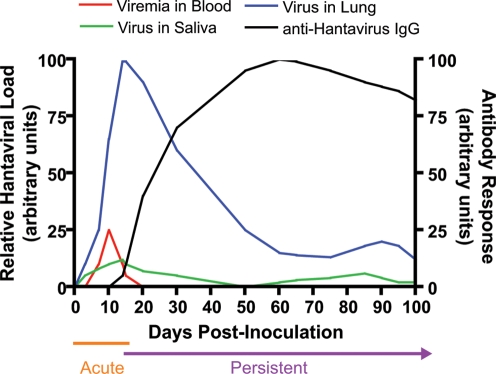
Figure 1. Kinetics of Hantavirus Infection in Rodents.
Adapted from Lee et al. [15] and others [12]–[14],[16],[18],[20], the kinetics of relative hantaviral load in blood (red), saliva (green), and lung tissue (blue) and antibody responses (black) during the acute and persistent phases of infection are represented. The amount of genomic viral RNA, infectious virus titer, and/or relative amount of viral antigen have been incorporated as relative hantaviral load. The antibody response is integrated as the relative amount of anti-hantavirus IgG and/or neutralizing antibody titers.

