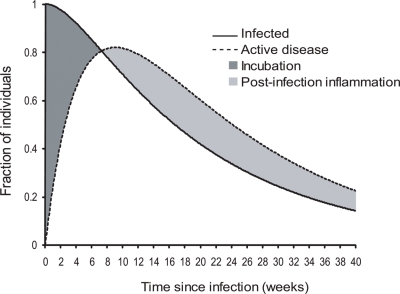
Figure 3. Development of active disease (TF/TI) after ocular infection with C. trachomatis estimated from cohort data under the standard model of trachoma natural history.
The fraction of individuals who remain infected (solid line) or who have active disease (dashed line) is plotted against the time since infection. The shaded areas highlight individuals with incubating infections or post-infection inflammation (active disease). The parameter estimates are from Table 2.

