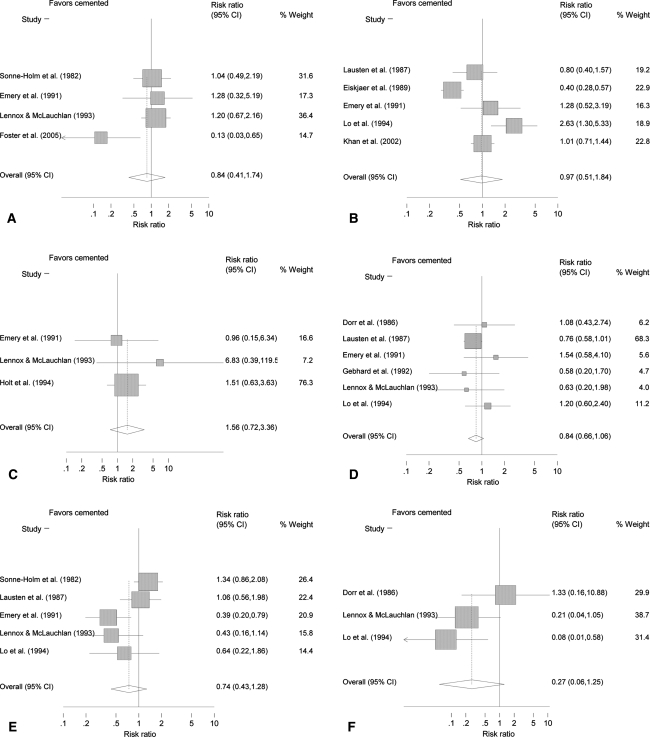
Fig. 2A–F.
Forest plots of the pooled RR for (A) perioperative mortality (less than 1 month), (B) intermediate followup (less than 3 months), (C) long-term followup (6 months and greater), (D) all complications, (E) revision, and (F) pain are shown. Each contributing manuscript (with summary effect at bottom) is shown with 95% confidence intervals for the RR (X axis) and percent weight contributing to the RE model.

